
Inferring Suppressed Data
Data vulnerabilities, systems of equations, and not sharing the code
Like all of my blog posts, these are my personal opinions and do not represent the opinions of my employer or the federal government.
One of my data hobbies is exploring local educational data. I live in Washington, DC, where I’m lucky to have access to a wealth of such data. For my first personal geospatial project, I made a Tableau dashboard that mapped recent condo sales to local school boundaries. A few years ago, I built a scraper that downloaded all of the schools’ COVID plans and pulled their text out.
But one of the biggest and most comprehensive local education data sets, and the one I’ve now spent the most time with, contains test scores.
DC satisfies its nationally mandated standardized testing requirements via a test given to 3rd through 10th graders. It used to be called the PARCC (Partnership for Assessment of Readiness for College and Careers). There’s no more partnership – the other states using it dropped out – so now it’s the DC CAPE, for the District of Columbia Comprehensive Assessments of Progress in Education.
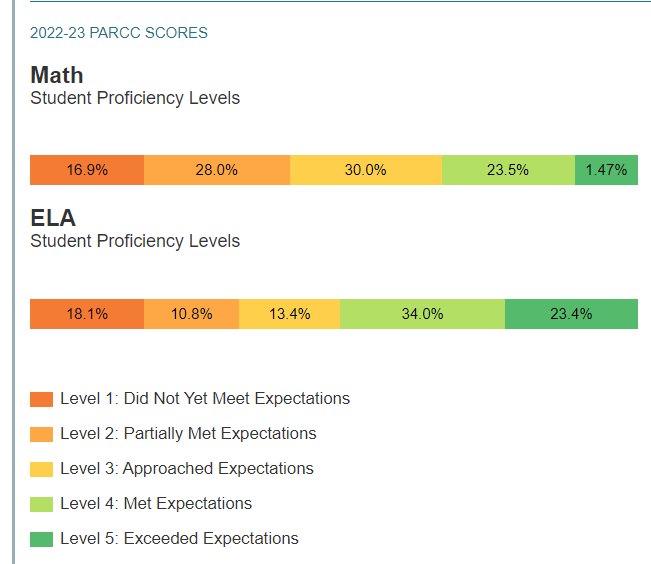
DC CAPE mainly covers math and ELA (English language arts/literacy). And DC OSSE, or the Office of the State Superintendent of Education, releases a lot of data on the results. At the school level, they release overall percentages of students meeting/exceeding expectations, but they also slice the data by various subgroups. These include student grade, the specific subject (for instance, some 8th graders take 8th-grade math, others algebra or geometry), and even demographic group. The scores themselves are also available at three different levels of aggregation: levels 1 through 5 individually, levels 3+ (approaching/meeting/exceeding expectation), and levels 4+ (meeting/exceeding expectations).
Is this data actually important or useful in any way? Your experience may vary, as they say. But, in addition to being the subject of analysis, it is used by some parents when picking schools. And because of the unique way DC does school admissions, parents don’t just make school decisions when they decide where to live.
Almost half of public-school students in DC attend lottery-based charters, but public schools with excess capacity also lottery off their spare seats. For the 2024-25 school year, there were over 24,000 school lottery applicants. Test scores are one of the data points parents use – the school lottery websites include that data, and parents can go directly to the spreadsheets for more details. While there’s a wealth of other data available on the DC public schools, including truancy data, AP test score data, and SAT scores, there’s less data available for charter schools.
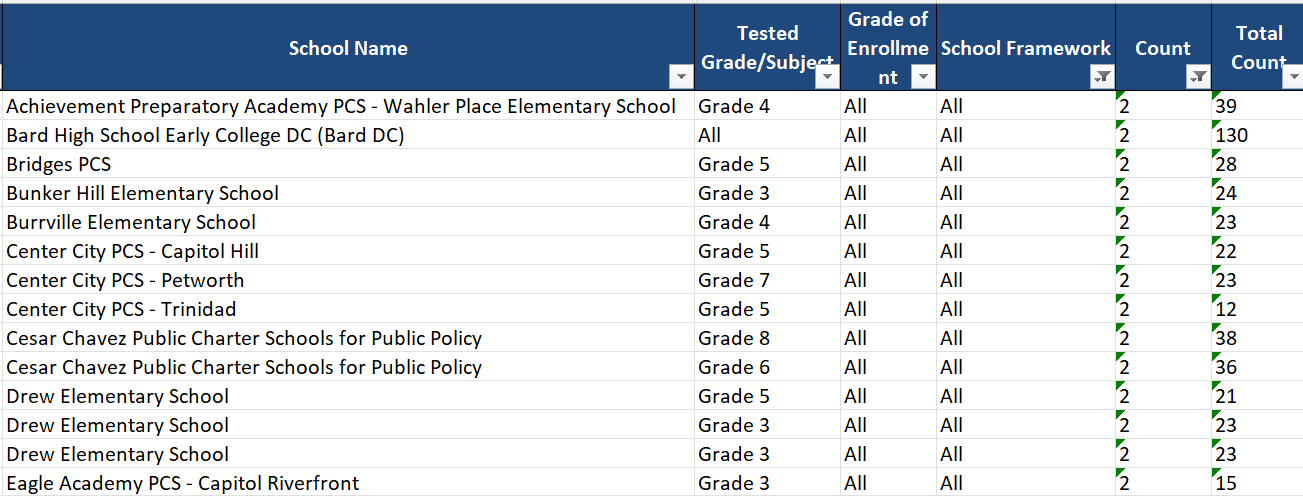
But, while a huge amount of DC CAPE data is released, some of the data is suppressed. The justification here is that they don’t want data to be identifiable – for someone to be able to figure out something about specific kids based on the data. Suppression is done in two ways. First, when the group in question is very small: this is primary suppression. But there’s also secondary suppression – when a subgroup isn’t itself very small, but revealing it would allow users to infer one of the numbers that’s undergone primary suppression. For instance, if one grade level’s data is suppressed due to size, another would need to be suppressed as well, or else it would be possible to infer the suppressed data via subtracting the remaining grades from the school-wide totals.
In theory, this goal makes sense to me. In practice, the choices of when to suppress often don’t make that much sense. First, there's significant suppression based on the size of the total group, or the denominator: all groups smaller than ten are suppressed. (This is based on national guidance.) There's much less based on the numerator. But it's a lot easier for me to infer something about group members if 2/130 tested proficient than if 5/9 did: I can make an extremely good guess statistically, but I also might know which of the two students out of 130 who passed the test, which would allow me infer that the other 128 did not.
But more importantly, the suppression strategies aren’t effective. Even with secondary suppression, you can figure out a lot of the missing values – on the school level if you can mess around in Excel and use formulas, and overall if you can abstract that process out and automate it using a programming language.
Which I did for the first time in 2022.
How Does It Work?
I used a few different strategies to figure out the missing data, but the main one was to take advantage of all of the linearly related data relationships.
For instance, if you suppress the count of students who are meeting/exceeding expectations (levels 4 + 5), but you share the number approaching/meeting/exceeding (levels 3-5), and you share counts for levels 1 and 2 – boom, linear system of equations; we can infer the value for meeting/exceeding. And there are SO MANY relationships like that in the data. I only explored a small percentage of them.

There are a couple of other sources of information in the data:
Some of the total counts for different groups are present in some tabs of the spreadsheet but not others. I wouldn’t necessarily call this a vulnerability – potentially it’s just not shared in some tabs because it’s a denominator value that’s not very useful if the numerator is suppressed. But I did use that information to populate missing values.
There’s a percentage column – the count of students at a particular level divided by the total number of students – which is sometimes populated with a range like <5% or >95%, even when the count value is suppressed. By using this in conjunction with the total count, we can incorporate this as an inequality bounding the possible outputs. (For instance, if the total count is 25 and the percentage range is <5%, the count value must be either 0 or 1.)
With the 2021-2022 data, I was inferring this with a combination of filling in total count numbers based on values contained elsewhere in the data, SymPy, which handled the linear equalities, and brute-forcing.
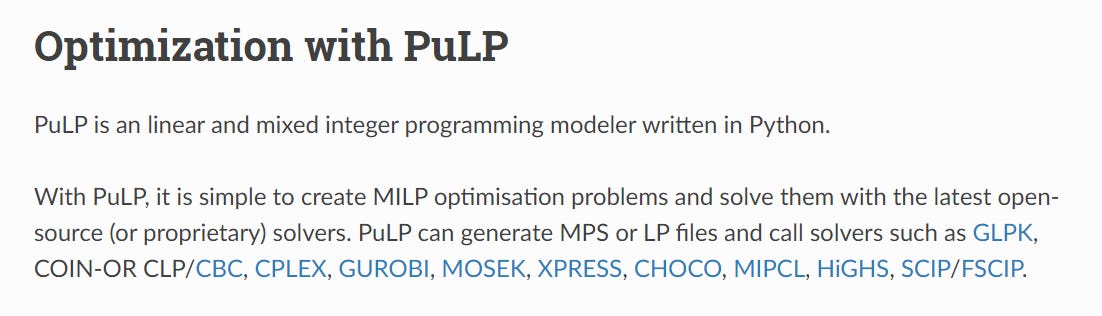
This year, I started using the Python package PuLP, which adds a couple of pieces of functionality. First, it gracefully handles the inequalities/constraints: it takes full advantage of the fact that no student groups are negative, as well as the greater than/less than percentage numbers. Second, because it solves equations by finding the minimum and maximum possible answers, it can find ranges of numbers for when it’s not possible to get an exact answer.
My code logs a lot of what it's doing, writes out the final data to spreadsheets, and highlights the numbers that were previously missing.
I also added some more testing. It works by obfuscating some of the numbers that are included in the data – that is, replacing data we already know – with variables. Then it uses my code to infer those variables, and compares the answer we found with the actual answer – which we knew, because it was initially present in the data.
My code exactly infers about 75% of the school- and grade-level meets-expectations and approaching-or-meets-expectations counts. That is, it finds the answer to about three out of every four missing cells in that category. For the rest, it finds a range – sometimes quite narrow, sometimes wider. For the “levels” data (the more granular performance data) the percentage exactly inferred is much lower – about a quarter.**
What Does It Mean to Responsibly Disclose Data Vulnerabilities?
In cybersecurity, there are responsible disclosure frameworks which involve giving package maintainers or vendors time to fix issues before you go on the internet and say HI EVERYONE THERE’S A VULNERABILITY. The idea is, you go to them, they fix it, and then you all can talk about it.
When I disclosed this issue to the DC OSSE in December 2022, I was hoping they’d remedy it, for example by following more of the methods from this NCES technical brief. These would have been straightforward to enact but, unfortunately, would have involved making less data available. Alternatively, I thought maybe they would disclose more values, since it was possible to figure them out anyway. I don’t know which of those would have been better; it’s not my data policy, so I can’t tell you how important it is that the suppressed data be actually unavailable.
But it didn’t make a lot of sense to me that they would do nothing. No public data should only be available to people who can solve systems of linear equations. Ideally, I was hoping to be able to turn my code over to someone who would use it to red-team different suppression strategies – that is, to try out different methods of suppressing data and see which were consistent with the results they wanted.
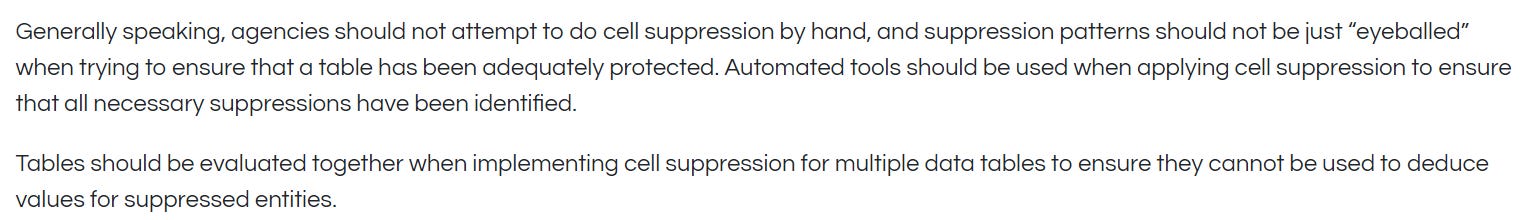
This would also be consistent with National Center for Education Statistics (NCES) guidance on the topic of cell suppression, which includes the following: “Automated tools should be used when applying cell suppression to ensure that all necessary suppressions have been identified.”
This did not happen. There have now been two annual data releases since I disclosed the vulnerability, the most recent of which was last month. The initial issues generally remain. When I asked recently, I was essentially told that it’s a balance between sharing useful data and privacy – and also that they weren't worried about this because it's not a thing that normal people in the community would do.
When the data issues didn’t get fixed, I struggled a lot with whether to just release the final data, or even the code. On the one hand, I’m not a party to FERPA, the Family Educational Rights and Privacy Act – which governs student data privacy issues. On the other hand, I don't have a great affirmative reason for sharing the data. Yes, to the extent that you think the suppressed version is useful or interesting, you'll probably find the more-complete version somewhat more useful or interesting. Yes, there are a couple of specific areas I think you can get a better picture of with the inferred data. But that doesn't seem like a good enough reason.
What about the idea that we shouldn’t talk about this at all? That even by discussing it, we’re creating risk?
I don't buy that.
I’m not the only person to have figured out you can infer some of the data – I’ve seen it discussed elsewhere by other people, although it was definitely the small-scale, mess-around-in-an-Excel-document type inference.
And if you think it's really bad or concerning that this vulnerability exists, the only way it's going to get fixed is by talking about it publicly. (Again, I already tried the other way.)
This also reminds me of some of the arguments around red-teaming models for LLMs. Like, if you think it’s dangerous for me to talk about how it’s possible to fine-tune GPT-3.5 to explain how to make sarin, the issue isn’t that I’m talking about it, it’s that the model can do it. And just as only OpenAI can fix that, only the data owners can fix their data vulnerabilities.
Or this might not be concerning at all, in which case we can definitely talk about it!
What’s Next?
Ideally, I’d like to be able to use this for good in the world – which probably means finding someone with a similar data problem who can use the concepts and maybe some of the code to better protect their own data. I've been asking around for people who might be able to do that, or who are just interested in giving my code a good home for something.
And in some ways, even though it didn’t end the way I was hoping, it was a successful side project. I became an expert on a small, local topic. And it reminded me of a major reason why I code: the ability to notice something small that it's possible to do by hand, and write code to do that at scale to solve a problem or answer a question we wouldn't be able to do otherwise.
__________________________________
*I’m simplifying some of this. For instance, there’s another test called the MSAA for students with significant cognitive disabilities, there’s a science exam, a few students take math exams for classes that they’re not currently enrolled in, and some don’t take a math test at all because they’re accelerated in math, etc.
**I don’t slice this up by grade of enrollment or any demographic data; my focus is on top-line numbers for school, and school/grade/subject.